How to find an underserved Shopify app niche without guessing

How to find an underserved Shopify app niche without guessing
The fastest way to find an underserved Shopify app niche is to stop looking at category size and start measuring demand against supply: a niche is open when real merchant demand (installs and reviews flowing in) is high but the number of capable apps serving it is low. You can read both signals straight from public App Store data, no surveys and no guessing. Below is the exact method, the trap that fools most builders, and where to get the per-niche read for your own shortlist.
Why "few apps" is the wrong way to spot a niche
Most builders look for a category with a small app count and call it open. That is backwards. A niche with ten apps and no merchant demand is not an opportunity, it is a warning that nobody is paying for the problem. And a niche with a thousand apps can still be wide open if almost all of those apps are dead listings with zero reviews.
The store rewards this misreading. Across all 21,749 live apps, 55.4% have zero reviews and the median app has exactly zero. So a raw category count is mostly counting apps that never found a single happy merchant. The real question is never "how many apps exist here." It is "is anyone actually using and paying for the apps that exist, and is that demand spread thin enough for a better one to win."
That reframe, demand versus supply, is the whole method. Everything below is how you measure each side.
The four signals that actually tell you a niche is underserved
For any niche you are weighing, read these four. None of them needs a single line of code.
1. Real demand: are merchants actually pulling apps in?
Demand is the side most builders skip, and it is the one that matters most. You measure it by review velocity (how many new reviews the apps in a niche pick up per month lately) and by install counts on the leaders. Reviews are a conservative proxy: only a fraction of installers ever leave one, so steady review flow means real, paying usage underneath.
A niche where the top apps each add a handful of reviews every month has live demand. A niche where even the leaders have been frozen at the same review count for a year does not, no matter how "unsolved" the problem feels to you.
2. Supply: how many apps actually serve this well?
Now count the real supply, not the listing count. Strip out everything with zero reviews and everything that has not been updated in years, and you are usually left with a much shorter list of genuine competitors. A category that looks crowded at 500 listings often has only 15 to 20 apps a merchant would seriously consider. Supply is that shorter number.
When demand is healthy and that real-supply number is small, you have found the gap. That is the definition of underserved: people want it, few good apps deliver it.
3. Beatability: how strong are the leaders, really?
A niche can have demand and thin supply and still be a bad bet if one excellent, deeply entrenched app owns it. So read the leaders honestly. Sort the niche by reviews, open the top apps, and read their 1 and 2 star reviews specifically. Those reviews are a free, brutally honest feature backlog. If the complaints are all about a missing capability, slow support, or a clunky setup, the leader is beatable. If the top apps sit at 4.9 stars with thousands of reviews and the only complaints are nitpicks, walk away.
This is also where the Built for Shopify badge matters: Shopify reports roughly a 14% install lift for apps that earn it, so a niche where no leader holds the badge is more beatable than its review counts suggest.
4. The first-party wall: has Shopify already built this in?
The signal builders forget. Before you commit, check whether Shopify already ships the feature natively, or has announced it. If core Shopify covers the job for free, the third-party demand quietly evaporates, and the apps still listed are coasting on old installs. A niche that looks underserved on app count can be underserved because Shopify ate it. Always check the platform first.
The trap: category size hides where demand actually goes
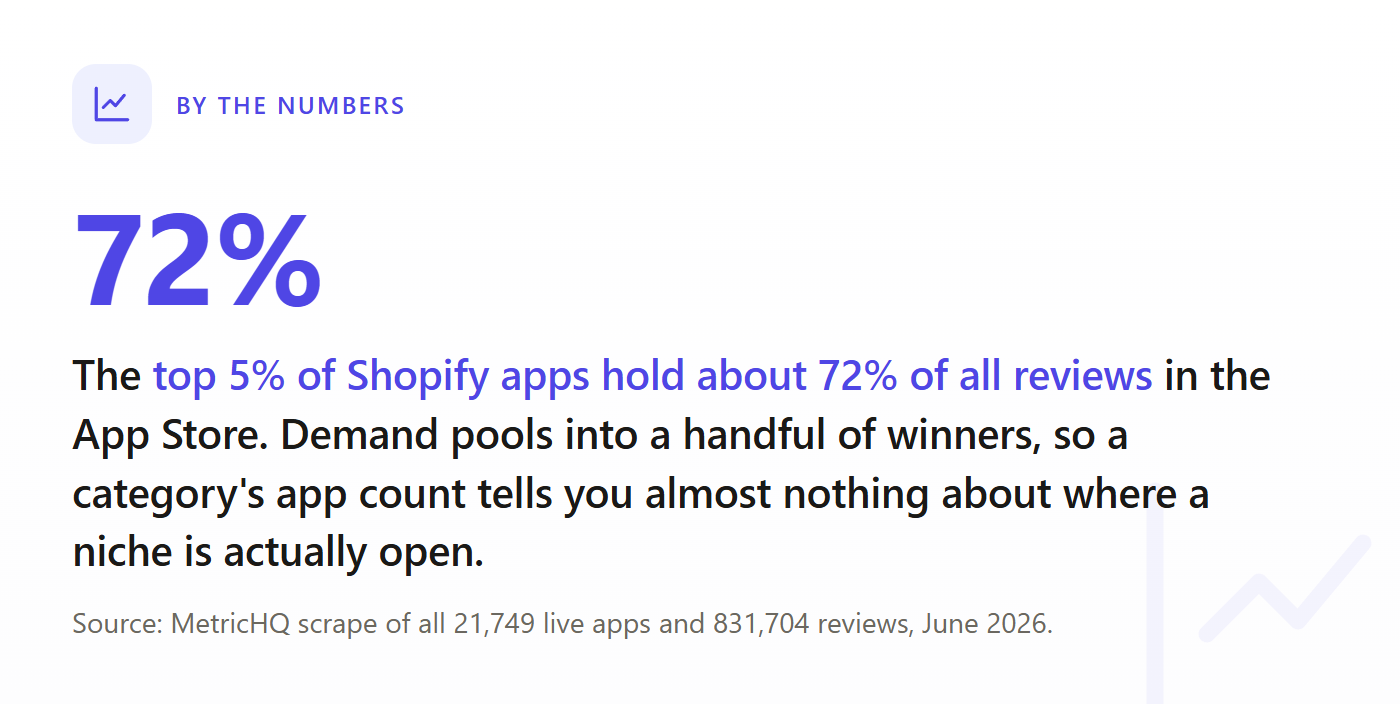
Here is the part that fools almost everyone. Demand in the App Store is not spread evenly across the apps in a niche. It pools into a tiny number of winners. Across the whole store, the top 5% of apps by reviews hold about 72% of all 831,704 reviews, and the top 1% alone hold 41%. The long tail gets almost nothing.
So when you see "Analytics: 1,228 apps," that count is hiding the real shape: a few giants soak up the demand and over a thousand apps split the scraps. The median analytics app has 5 reviews. The median across the whole store is 0. Category size tells you how loud a niche looks, not whether demand is reachable inside it.
This is exactly why you cannot eyeball a niche from the App Store front page. The front page shows you the winners, which makes every niche look saturated, when the real question is whether demand is concentrated in beatable apps or genuinely locked up. You have to look at the distribution underneath, per niche, to know.
The obvious crowded ones you already know: analytics, product reviews, email marketing. Those are not where you start. The useful niches are the ones where this demand-versus-supply math quietly tips the other way, and those are not visible from the front page at all.
Putting it together: one worked read
Take bundles as a concrete example, because it shows the method end to end. It is a large market with moderate competition, the established apps mostly charge (so merchants clearly pay for the problem), and the median paid plan sits around $13 per month. The Market Validator scores it 51 out of 100 and projects, at a $2,500 monthly ad budget and that price, ads paying back around month 39. That is a real, specific read: healthy demand, real money, but a slow payback because acquisition is expensive in a market that size.
That single read tells you more than scanning a hundred listings would. It is the same four-signal math above, run over the live data and turned into numbers you can plan against. Below is what that output looks like.
The point is not bundles specifically. It is that every niche has a read like this, and the open ones are the niches where the score is high, the leaders are beatable, and the payback math works in your favor. Those are the ones worth your next year.
How this connects to actually building
Finding the niche is step one. Once you have a candidate, the next job is to pressure-test it before writing code, which is its own discipline: confirming willingness to pay, sizing the real supply, and checking the first-party wall in detail. We walk through that in how to validate a Shopify app idea before you write any code. And if you want to see which categories are genuinely jammed versus quietly open, the most saturated Shopify app categories in 2026 maps the crowded end so you know what to avoid. For the bigger picture on how fast the store is filling up, see our scrape of the whole Shopify App Store.
My honest take after reading the whole store: the niches worth building in are rarely the empty-looking ones. They are the ones with obvious demand and a leader that stopped trying. Those hide in plain sight, and they are exactly what a per-niche read surfaces.
Get the per-niche read
The method above gets you most of the way. The part that is genuinely hard to do by hand is running the demand-versus-supply math across every niche at once and ranking where the gap is widest right now. That is what the Market Validator does: you give it a market, your price, and a budget, and it returns the demand and supply read, how beatable the leaders are, and a payback projection, all from the live App Store data.
See where demand beats supply, niche by niche
We scraped every app on the Shopify App Store. Check any niche for saturation, demand, and the gaps worth building, in seconds, before you write a line of code.